Tableau Design System for a Global Pharma Company.
NDA Notice. The visuals on this page are reconstructed concept work. They contain no original data and no original client screenshots.
/
Context
Inconsistent dashboards weakened trust in the data.
Each team had built dashboards in its own visual style. Users questioned the data not because of quality, but because inconsistent interfaces signaled no shared standard. The brief: inventory the landscape, prioritize patterns worth keeping, and harmonize the rest into a foundation that scales across regions and teams.

/
Approach & Decisions
Every rule designed for native Tableau reproduction.
KPI patterns were rebuilt from scratch because the originals were off brand. Tableau's native constraints drove every decision: if a developer cannot reproduce a component without help, it was cut. Color logic uses one primary plus one accent so priority KPIs scan first. Two guides serve two audiences: builders and readers.

/
Components and Chart Library
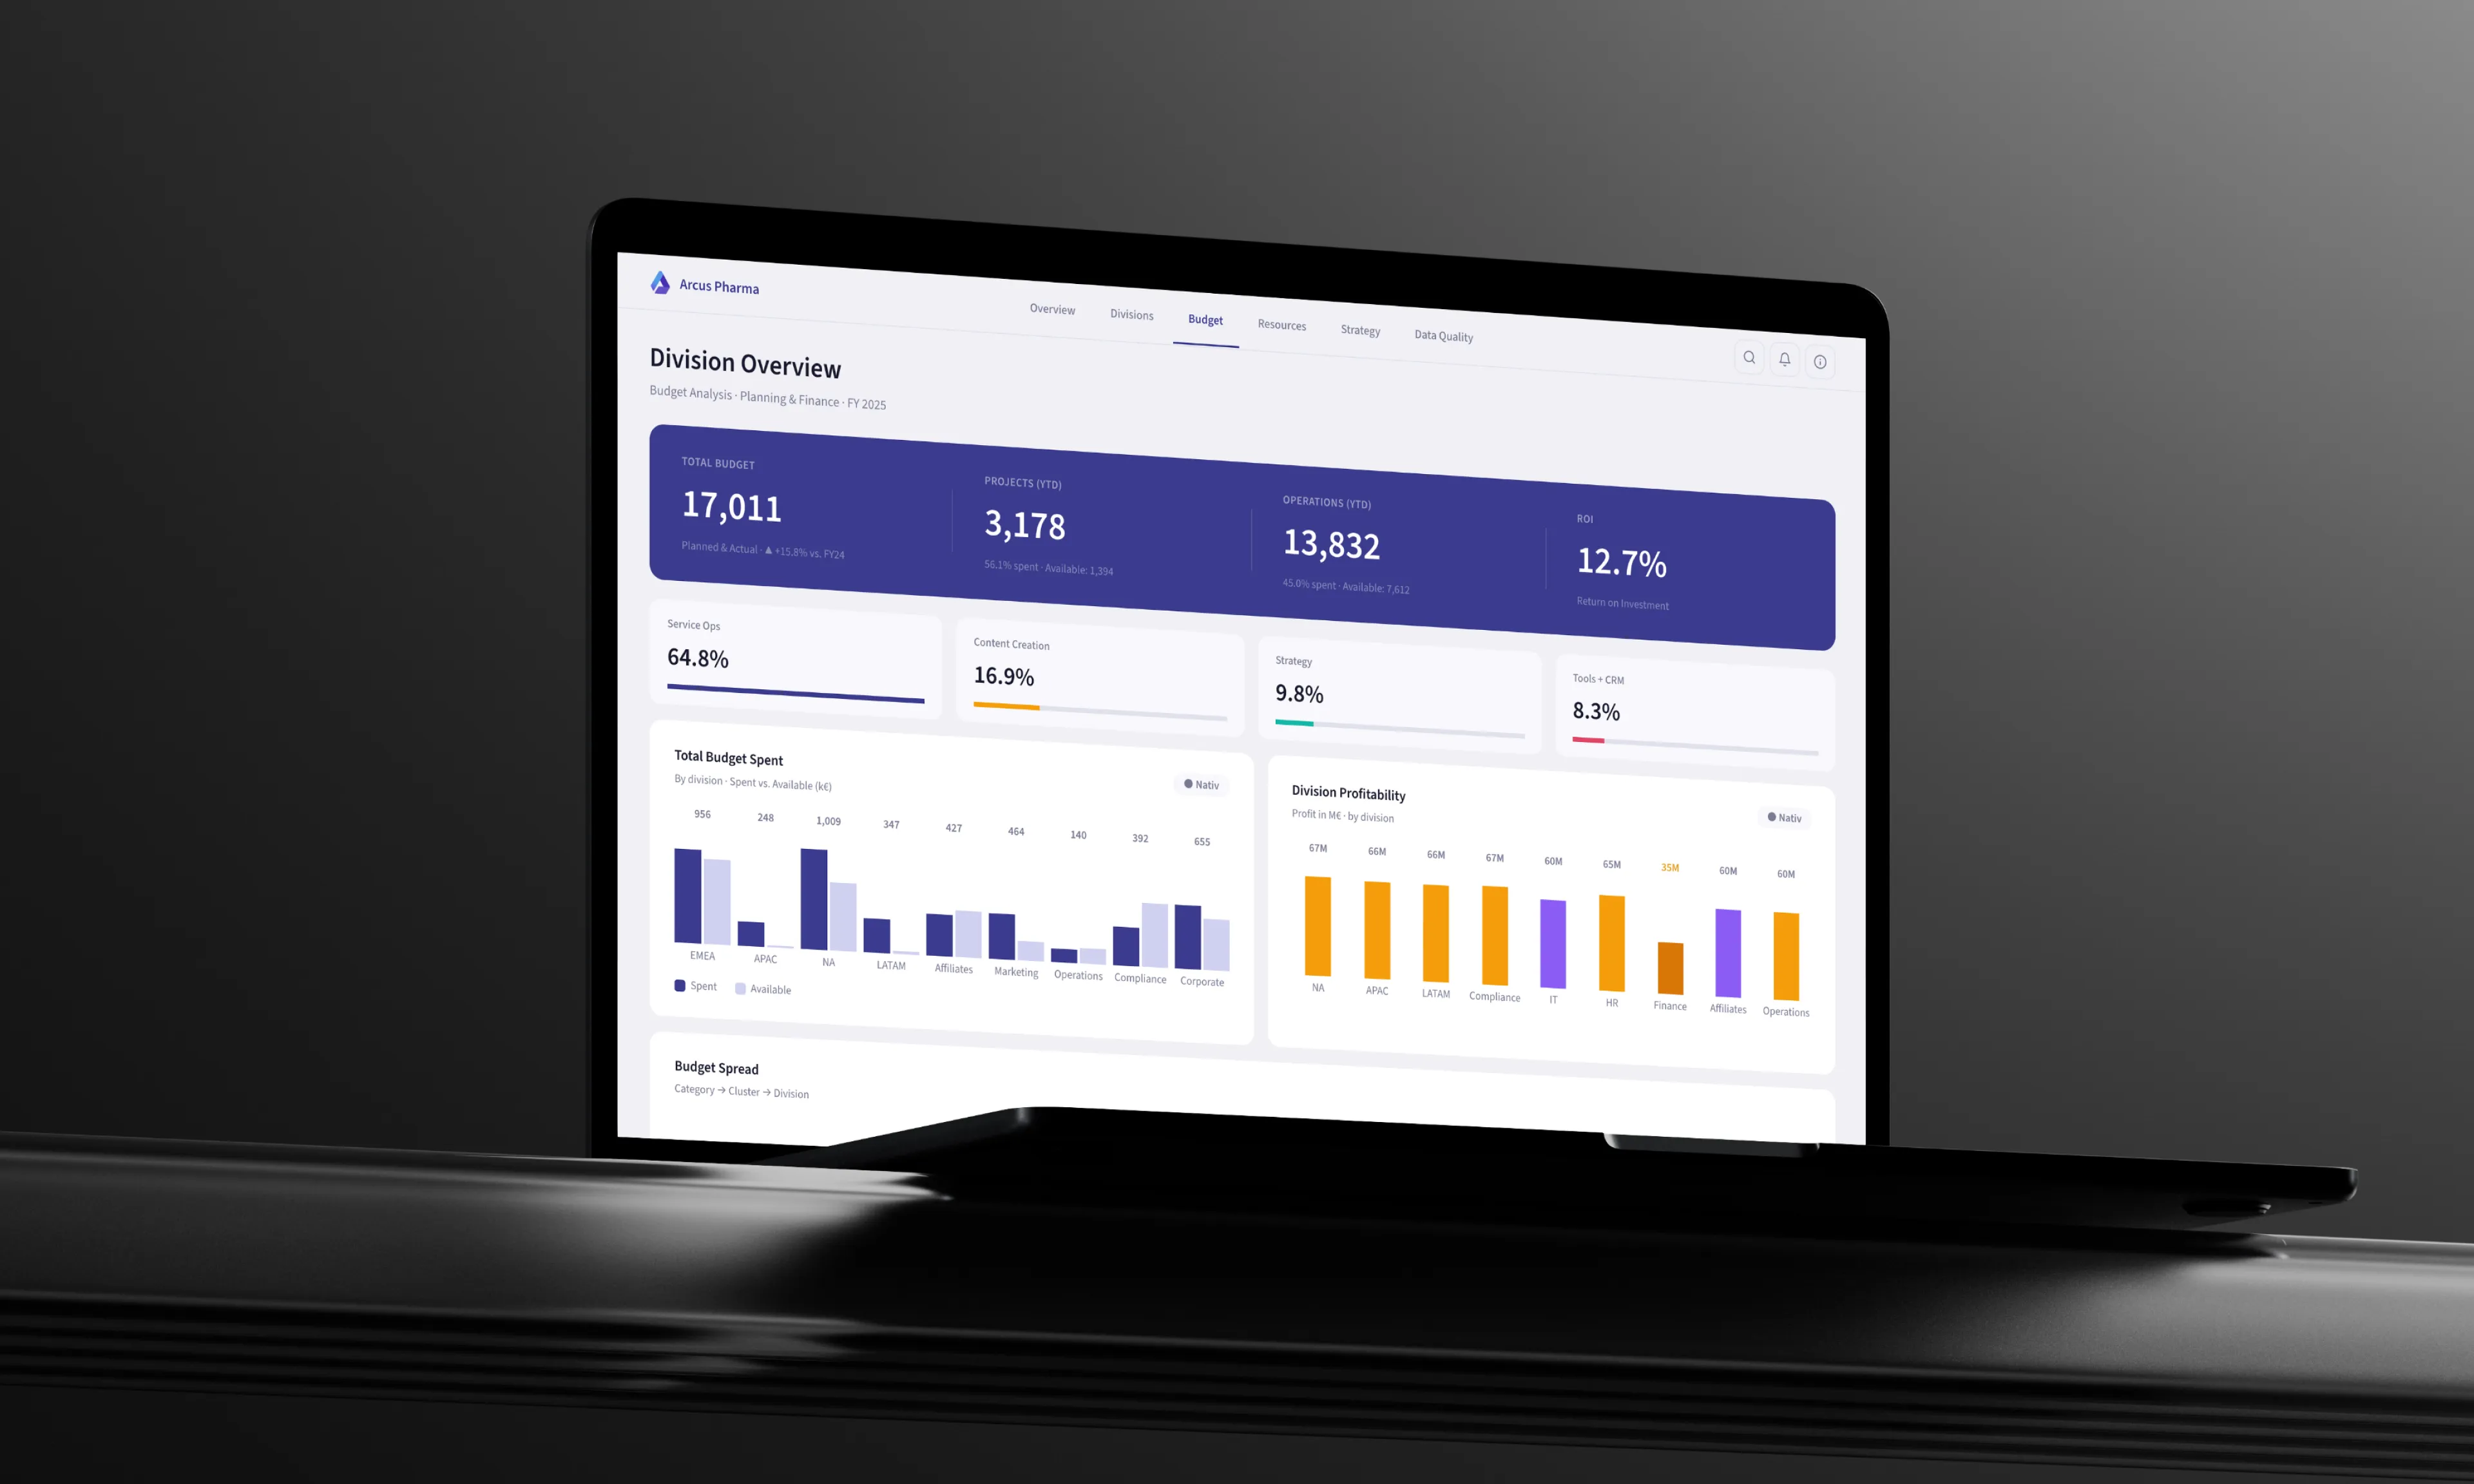
A chart library built for native reproducibility in Tableau.
The chart library covers all common patterns: bar charts, donut and pie, stacked bars, treemaps, heatmaps. Every chart is specified down to bar height, label position, grid weight, and legend style. Semantic accents keep status and category readable. Builders pull a spec, reproduce it in Tableau, and ship without design back and forth.

/
Brand Layer for Communication
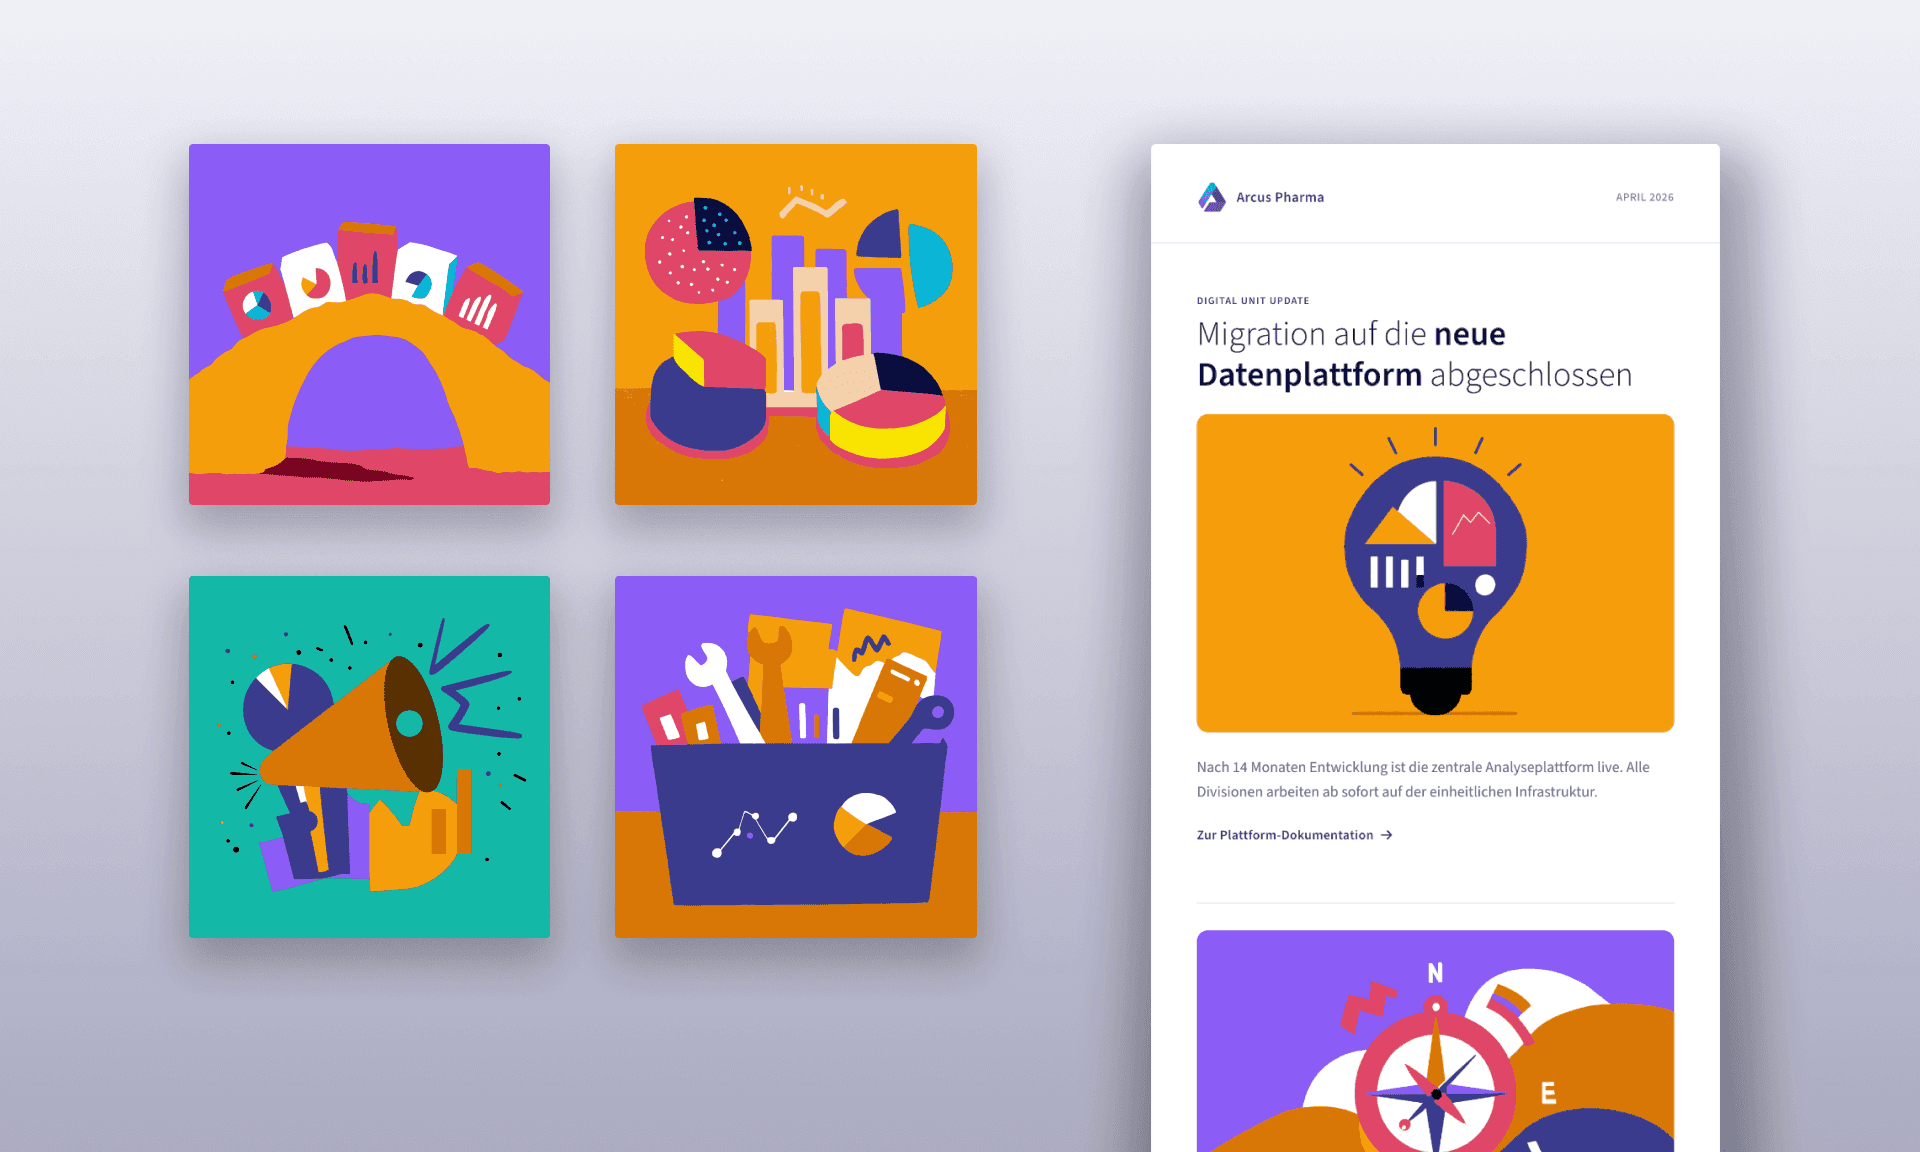
AI-generated illustrations matched to the corporate style guide.
Beyond dashboards, the team needed visuals for newsletters and internal communication. The challenge: an illustration style was already defined in the corporate brand guidelines and any new visual had to stay consistent with it. I generated illustrations with AI, prompting and curating iteratively until the output matched the established system.
/
Outcome
Defined as the standard for all new dashboards in the portfolio.
Templates, dev guide, and user guide enable consistent implementation without ongoing design coordination. The project lead rated the work as exceeding expectations, citing independent ownership, deliverable quality, and direct stakeholder communication. The system was classified as a critical foundation for harmonization across the portfolio.
/
More Work
Continue Exploring.
Other projects from my portfolio, spanning different industries and challenges.

